

Customer Lifetime Value (CLV) or Lifetime Value (LTV) is a fundamental concept in Business Analytics. It shows the monetary value (profit, gross margin, or often simply revenue or sales) a single customer has generated over their “life” with the company.
For the sake of simplicity, let’s define CLV as revenue.
If I ordered 3 items worth $25 each, my CLV would be $75.
Why is CLV important to look at?
It might be your CMO, your CEO or your Investors. But sooner or later somebody will ask: “What’s the CLV?”
Why is this metric so important?
A lot of markets are competitive, which means it’s expensive to acquire new customers. Would you be willing to spend $30 to get $25 revenue? Rather not.
But trading $30 for $75 already looks like a better deal, right?
Also, seeing customers return and make multiple orders indicates that your product adds value.
If you have investors, they also want to validate that your business found a “Product Market Fit”, and understand unit economics and business sustainability. I.e. venture-backed companies might decide to acquire customers even more aggressively, knowing that customers will come back, sacrificing the profitability of the first few orders but gaining market share and overall userbase.
Breaking down CLV

In my example above, I generated a CLV of $75.
Imagine we’re in March 2025: Customers acquired in August 2024 generated an average of $92. Customers in January 2025 generate only $80.
This trend might look worrying at first, but is just an illustration of how something can be displayed in a very misleading way.
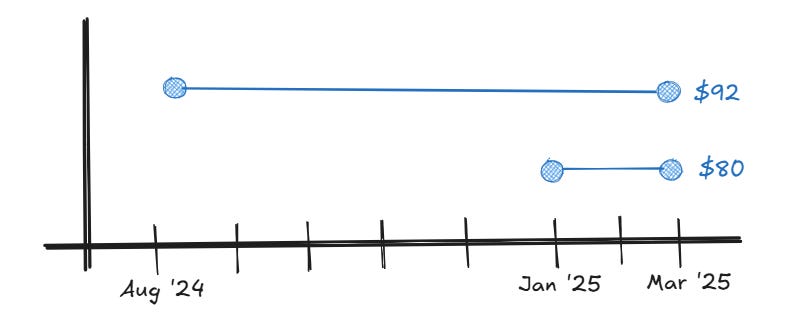
Be aware that it’s not a fair comparison at all. Customers acquired in August had 8 months until January to generate this $92 CLV, whereas customers of January just had a few days. This is where “Cohort Analysis” comes into play.
A cohort is a group of people sharing common characteristics, in this case, months of acquisition. Cohort Analysis usually involves breaking down the different groups across a time period. In a business context, this is usually the time a customer is not defined as churned (can be difficult) or simply the time since the sign-up or first purchase - the acquisition.

How about this chart? It’s hopefully less misleading as we break down each bar into the tenure months. We see that the newer bars (let’s call them “cohorts”) have fewer tenure months, but Month 0 alone is steadily increasing.
What would be a fairer comparison is to only include months available for every cohort. In our example, it would be the first two months, as the newest cohort had from January until March. This way we would see a continuous upward trend in CLV value.

Another common visualization technique for cohorts is a cumulative line plot. Each line represents a cohort. The X-axis shows the lifetime of the cohorts as “Tenure Month”. This chart is a decent trade-off between showing the CLV of older cohorts and benchmarking the newer ones without any bias.
It also allows the viewer to extrapolate the lines with their own eyes and visualize the natural “plateau” of CLV: A lot of customers will stick with you for a few weeks, but only a few will tick for years (depending on the business of course).

Summary
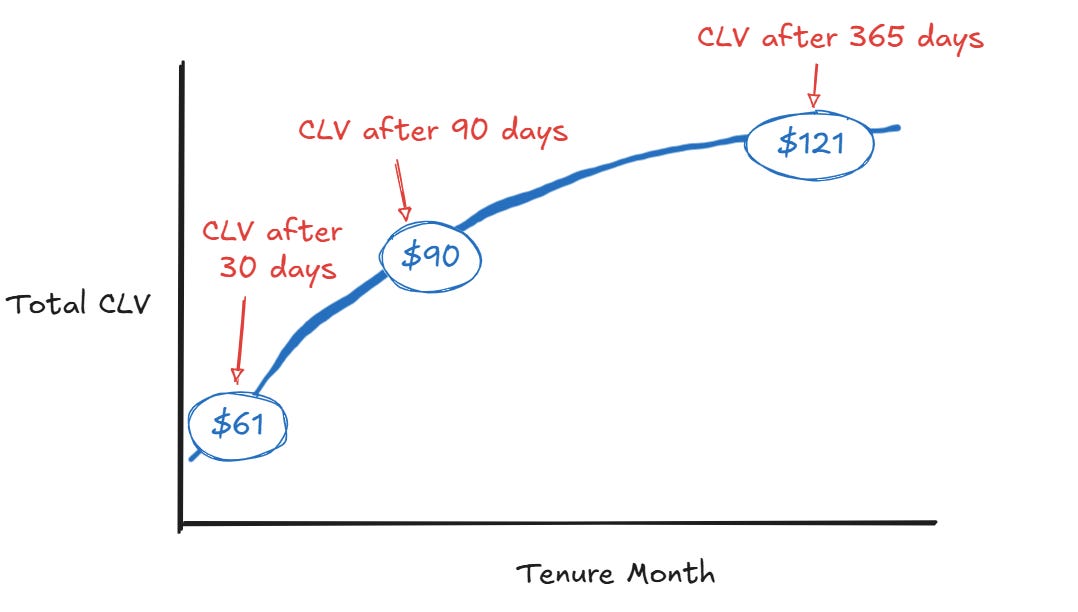
I hope that the next time you get asked to deliver THE CLV, you know to follow up on the details of the visualization. Do they want to benchmark the CLV across cohorts? Do you have default time windows (e.g. 30, 90, and 365 days) to report on? The single CLV does not exist as the “Lifetime” part of it is hard to define. Most companies simply do not know if their customers will ever come back and even for subscription-based businesses people can cancel and come back at a later point. While there are many ways to handle that (e.g. here), the easiest way is to define certain periods you want to measure and improve.
In a future post, I am going to show how to make Cohort Analysis more actionable beyond the classic financial reporting discussed here :)
Great overview, Tim! A common definition of CLV is central for any data-driven organization. Would love to hear your thoughts about how to define the „Value“ part as it can be a contentious point when defining CLV if it’s revenue, profit or something in between.